


We Don’t See the Spots Where There Are No Cameras
In simple terms, a hook is like placing a “sensor” on certain operating system functions: every time the malware calls that function, the sensor records the action. This allows us to observe what the malware does without having to perform a manual line-by-line analysis.

The main problem is that malware activity is only captured when it calls specific functions where hooks have been placed. This means that any action the malware executes through unmonitored APIs can go unnoticed.
But there are also other limitations and problems with this system…
Several Ways to Do the Same Thing, but Only One Logging Point
Another challenge arises from the variety of ways in which malware can carry out the same action. Windows has hundreds, if not thousands, of relevant functions spread across multiple DLLs.
KERNEL32.DLLNTDLL.DLLUSER32.DLLADVAPI32.DLL- etc
Imagine a malware sample that attempts to create a process, for example, by executing cmd.exe — a typical scenario. This malware could use different Windows API functions to do so, such as CreateProcess or ShellExecute.

Some sandboxes try to solve this by placing hooks on the lowest-level APIs. In the case we are looking at as an example, the solution would be to place the sensor on the CreateProcessInternalW or NtCreateUserProcess function.
However, this solution introduces an additional problem: detail is lost.
A detail that can be fundamental to clearly distinguishing one malware family from another, or to determining why a particular security solution, such as an EDR, is not able to detect the malicious activity.
If we have two malware families, one that uses ShellExecute and another that uses CreateProcess, both will look identical, because in our log of the behavior of both, the same function will appear: NtCreateUserProcess.
The Importance of Details
In the age of artificial intelligence, this granularity in the recording of details is not a luxury, but a necessity. An AI that automatically analyzes malware will only be able to correctly differentiate between families if it knows exactly which APIs were called.
Without recording the precise details of which functions and exact parameters were used by malware, the analysis necessarily becomes superficial. For a human analyst, this means that inferences about the behavior of the malware are based on incomplete information: it may appear that two samples perform the same action, when in reality they use different techniques, with different objectives or levels of sophistication.
To illustrate the importance of not missing details, imagine a sketch of a suspect in which the hair color, the shape of the nose, or any distinctive feature is not indicated.

With incomplete information, the probabilities of stopping the wrong person increase dramatically. In the same way, in malware analysis, the omission of precise details about which APIs were called can lead to mistaken conclusions and limit the effectiveness of automated systems.
The greater the level of detail, precision, and granularity of the information available, the greater the probability of obtaining reliable and effective results from systems that depend on the quality of this information.
Maintenance and Evolution Considerations
The problem of maintaining complete hook coverage is not only its technical complexity, but its lack of scalability in the long term. A sandbox based on API interception requires monitoring hundreds of system functions, which already implies a high maintenance cost. But the real bottleneck appears when the analysis system becomes anchored to a specific version of Windows.
Many solutions derived from Cuckoo Sandbox were originally designed for environments such as Windows 7, where the set of APIs and behaviors was well bounded and relatively stable. However, over time, new versions of Windows introduce internal changes, new execution paths, and more complex mechanisms that do not fit directly into that initial hook system.
This leads to a typical situation: the sandbox continues to operate on Windows 7, but the ecosystem it is trying to analyze no longer corresponds to that environment. Migrating it to more modern versions is not a simple update, but a deep reimplementation of the entire instrumentation layer. As a result, many of these solutions remain “frozen” on old systems for years, not by choice, but because the cost of a complete update of the hook model is too high compared to the practical benefit.
Sandbox With Kernel-Level Hooks
Placing hooks in the kernel is not a perfect solution either. The reason is simple: the kernel only “sees” what actually reaches it. That is, it can only record those operations that end up making a system call, when the program transitions from user mode to kernel mode.
But many actions never reach that point. Some functions are resolved entirely within user space itself, without needing to ask the operating system for help at its lowest level. Those calls never “touch” the kernel, so a hook there would not see them.
In addition, when malware calls a high-level API, that call passes through several intermediate layers before reaching the kernel. Along this path, a single “visible” call can be broken down into several internal operations, or even merged with others.
That is why, in the record of malicious activity captured using kernel-level hooks, what is observed are final system events, not the original intentions of the program. A kind of rather abstract “background noise” that does not represent what the malware actually did, and we thus return to the problem of detail, granularity of information, and the need for accuracy.
Look Ma! No Hooks!
At this point, the problem becomes clear: we need a way to observe which Windows APIs the malware uses – whatever DLL they come from – without having to manually create and maintain hundreds or thousands of individual hooks.
The traditional approach of intercepting functions one by one, whether in userland or in the kernel, does not scale well: it is fragile, expensive to maintain, and always leaves gaps. In addition, each new version of Windows introduces changes that force the entire instrumentation layer to be constantly reviewed.
For this reason, the real need is different: a generic instrumentation solution, capable of systematically capturing Windows API calls without depending on specific hooks per function or per DLL.
In other words, instead of “hooking specific functions,” what was sought was a more abstract and robust mechanism that allows API usage to be recorded globally.
To achieve this, we developed a solution that abandons the traditional hook-based approach and focuses on the control of memory page permissions within the process being analyzed. Let’s look at its implementation:
The Implementation
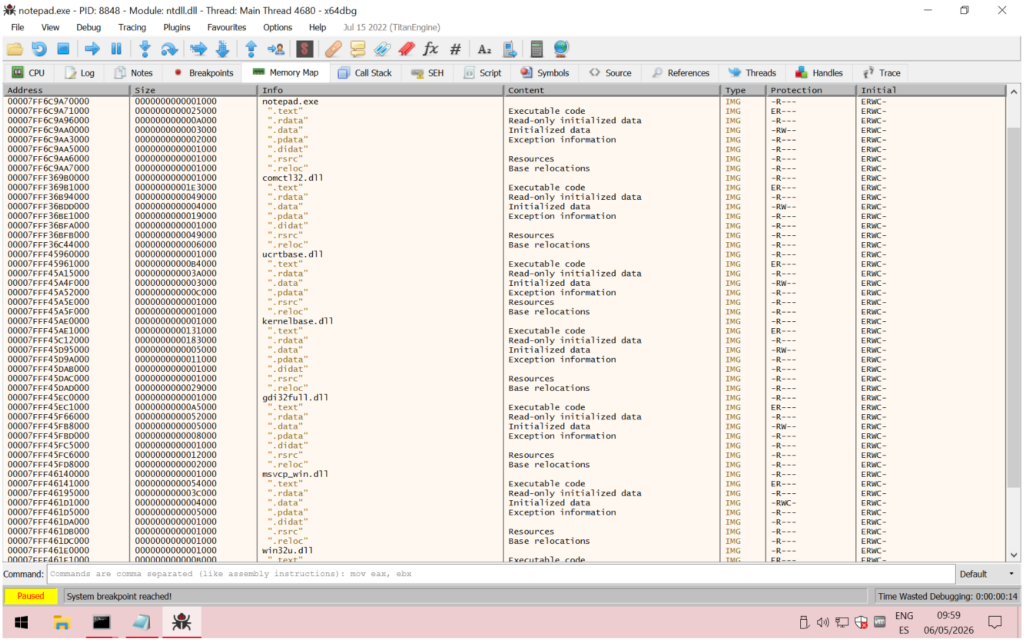
When malware runs on Windows, its code lives in its own memory area. The operating system libraries — Windows DLLs, such as KERNEL32.DLL, NTDLL.DLL, or SHELL32.DLL — live in a different area.
Every time the malware wants to do something: create a process, read a file, connect to the network; it has to “cross” from its own territory to Windows’ territory, execute the function it needs, and return with the result.
As we have seen, traditional sandboxes place sensors inside Windows territory, on specific functions.
Our implementation does something different: it watches the border itself.
Each running process has its own memory map, made up of blocks called VADs: Virtual Address Descriptors. The space occupied by the main executable has its own VAD, and we also have VADs for each of the DLLs that the executable has loaded into memory and for each block of memory it has reserved.
Internally, these VADs are organized as a balanced tree, historically an AVL tree. The EPROCESS structure, which defines the details of each running process, has a field called VadRoot that points to this tree and defines its memory map.
From the point of view of malware analysis, the VAD tree is especially interesting because:
- It reflects all the virtual memory of the process, even regions that do not go through high-level APIs
- It allows the detection of code injections, suspicious RWX regions, or executable memory not backed by a file
- It does not depend on userland hooks, since it is information maintained directly by the kernel
For this reason, many advanced analysis and memory forensics techniques prefer to inspect the VAD tree rather than relying solely on API instrumentation. And in our case, this tree allows us to intercept the passage from memory zones corresponding to operating system elements to memory zones belonging to the process being analyzed. In other words, it allows us to “hook” all the system DLLs in a generic way without having to create specific implementations for each function of the API.
How It Works: Memory Permissions as a Control Point
One of the most advanced elements of the Zynap Sandbox is its ability to manipulate memory permissions directly on the Page Table Entries (PTE), the lowest-level structure used by the system to manage the mapping and attributes of memory pages. As this is a structure accessible only from kernel mode, this approach allows it to operate beyond the reach of software running in user space.

Thanks to this, the Sandbox can dynamically modify read, write, or execute permissions without resorting to traditional APIs or generating artifacts easily detectable by the malware. From the perspective of the analyzed sample, these modifications are practically invisible, allowing much more transparent instrumentation that is resistant to modern evasion and anti-analysis techniques.
In our implementation we manipulate the permissions of the memory pages corresponding to the Windows libraries within the analyzed process, so that any attempt by the malware to execute code on those pages generates a controlled exception.
That exception is intercepted by our components — which operate both at the Windows driver level and at the hypervisor level — before it reaches the process being analyzed.
At that moment the complete call is recorded: A “snapshot” of the CPU state at that moment that includes the value of each register and, for those registers that point to valid memory, a dump of the contents of that area.
This allows all calls to the Windows API to be recorded, from which memory address they were made, the code responsible for the call, the values of all the parameters and the contents of the memory for all the pointers.
Execution is then allowed to continue normally. The same mechanism acts on the return, when the library returns control to the malware, also capturing the result.
For the malware, everything happens transparently. For us, we have a complete record of each border crossing, in both directions. This record of the malware’s activity contains a level of detail that had not been reached before and that allows an instrumentation never seen before.
Total Coverage
Let’s go back to the first problem: the spots without cameras. With this approach, there are none. It doesn’t matter if the malware calls CreateProcess, ShellExecute, an undocumented internal function of ntdll.dll, or any other function of any Windows DLL: to execute it, it has to cross the border, and at the border is our control point.
There is no need to know in advance which functions exist or which ones the malware might use. Coverage is complete by construction, not by enumeration.
The Detail That Differentiates Families
The recording of activity takes place exactly at the moment the malware invokes the function, whatever it may be. If one family uses ShellExecute and another uses CreateProcess, both cross the border at different points: they are recorded differently, with their own parameters, and the analysis can distinguish them unambiguously.
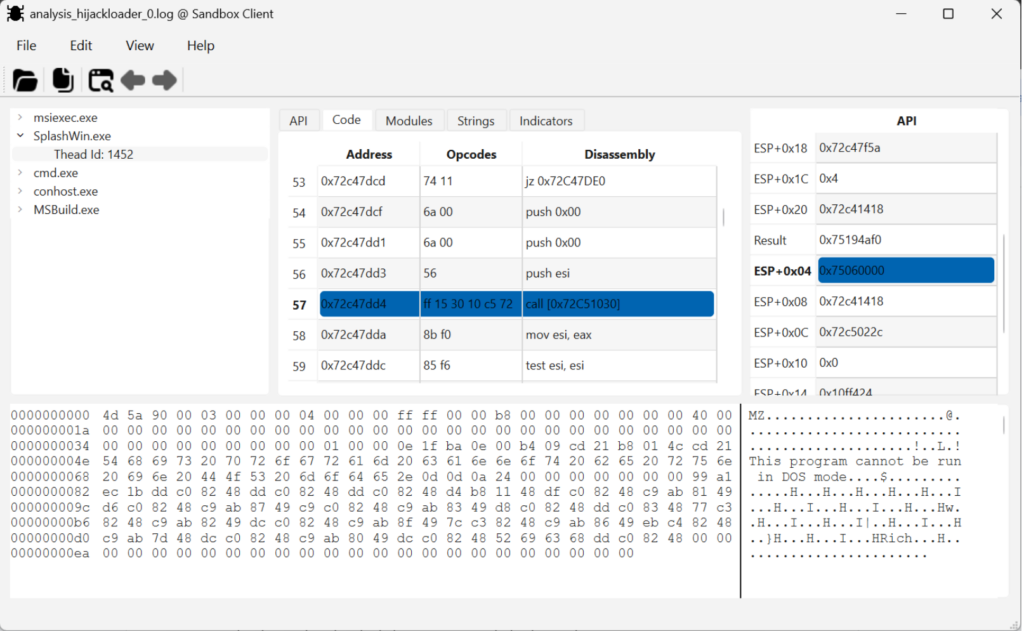
Not only is what function was called captured, but also from which exact address of the malicious code the call was made. This allows, for example, correlating several consecutive calls and understanding the logical sequence of the malware, not just an isolated list of actions.
The result not only guides us through the operation of the malware as it was created, but also makes it easier to navigate its code using other reverse engineering tools: With IDA, for example, we can more easily navigate the code of a sample, locating the points of interest that we might want to analyze manually.
Text Strings
All those of us who have dedicated ourselves to malware analysis know the value that text strings have. They often allow us to obtain a first picture of what is hidden inside a sample.
In cases where the malware does not use encryption, or when they are obtained from memory dumps in which the encrypted areas are already exposed, these strings allow us to easily identify much of the operation of that sample.
It is because of their value that both static analysis tools and most sandboxes allow a dump of these text strings to be obtained.
In the case of a static analysis the problem is clear: If the sample is packed, or if the text strings are encrypted, we will not see anything in that dump.
Things take on a different color when these text strings are extracted during the execution of the sample. The malware may already be unpacked in memory, or the dump may take place at a time when certain sensitive areas of its configuration are exposed.
But what on the one hand is an advantage, is at the same time a drawback.
The complete dump of the text strings present in the entire memory address space of the running sample does not only include those that belong to the malware. Along with these also appear hundreds, if not thousands, of text strings that are part of the Windows DLLs or other components that intervene in the execution of the sample, such as the browser or system tools like cmd.exe or regsvr32.exe, for example.
Thus, what could be an important indicator is hidden under an amalgam of text strings that do not provide any valuable information to the analyst.
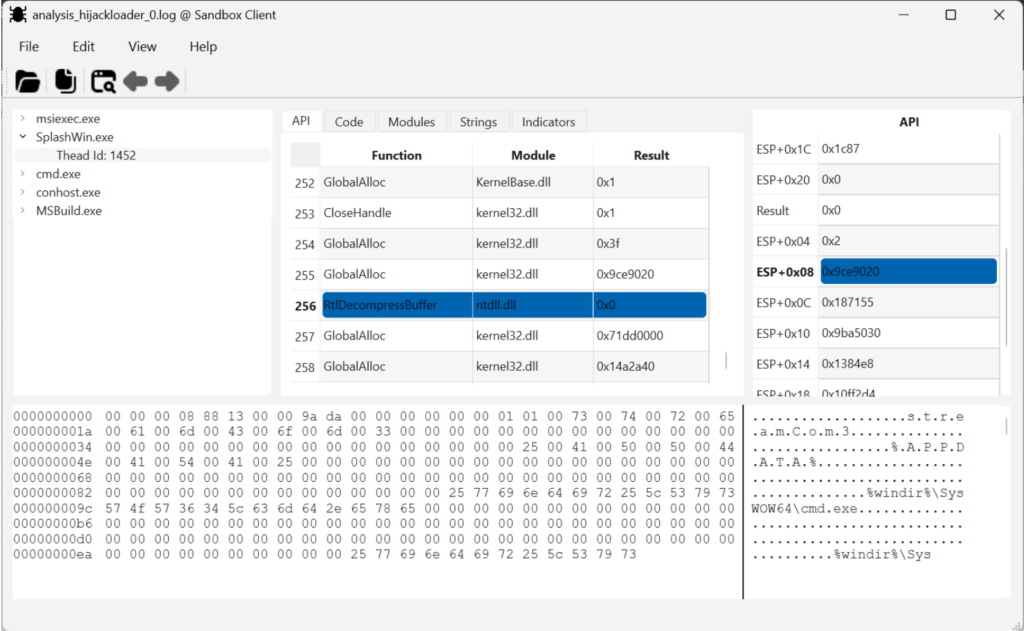
In the implementation we have created, a dump is made of those text strings that have been used during each of the calls that the malware makes to the Windows API.
The result is a clean list of strings, lacking operating system artifacts. All of them are part of some step or mechanism in the execution of the sample. This makes this string dump a much more valuable tool for the analyst, facilitating its use and exploitation.
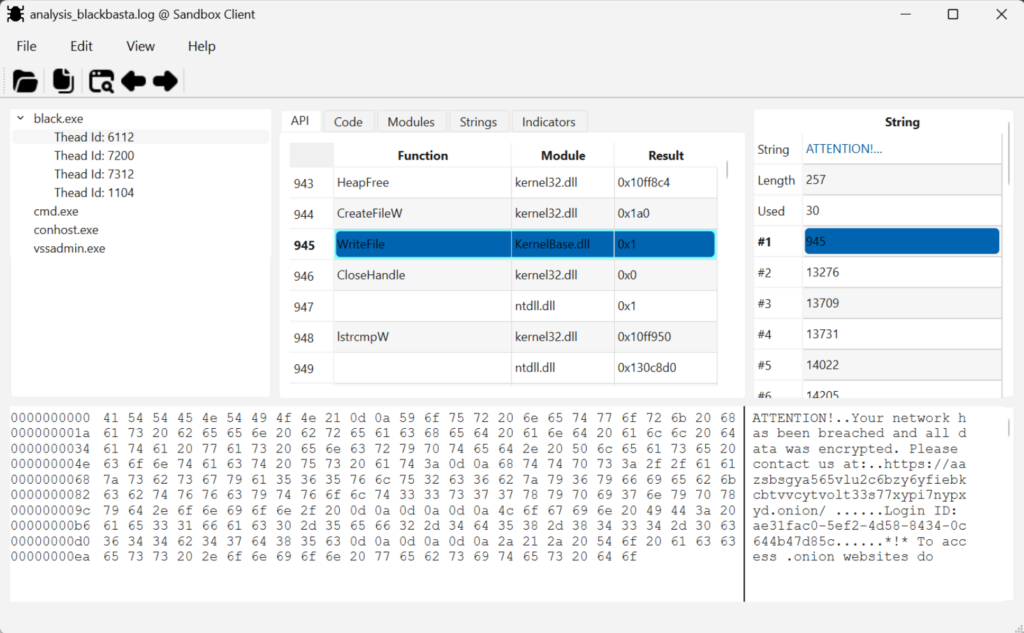
In this dump, important elements of the behavior of the analyzed sample can be quickly observed:
- Names of the Mutexes created
- Paths of files created or accessed
- Windows registry keys created or accessed
- Debug log lines emitted by certain families
- “Ransom notes” used by Ransomware-type malware
- URLs of control panels
- etc
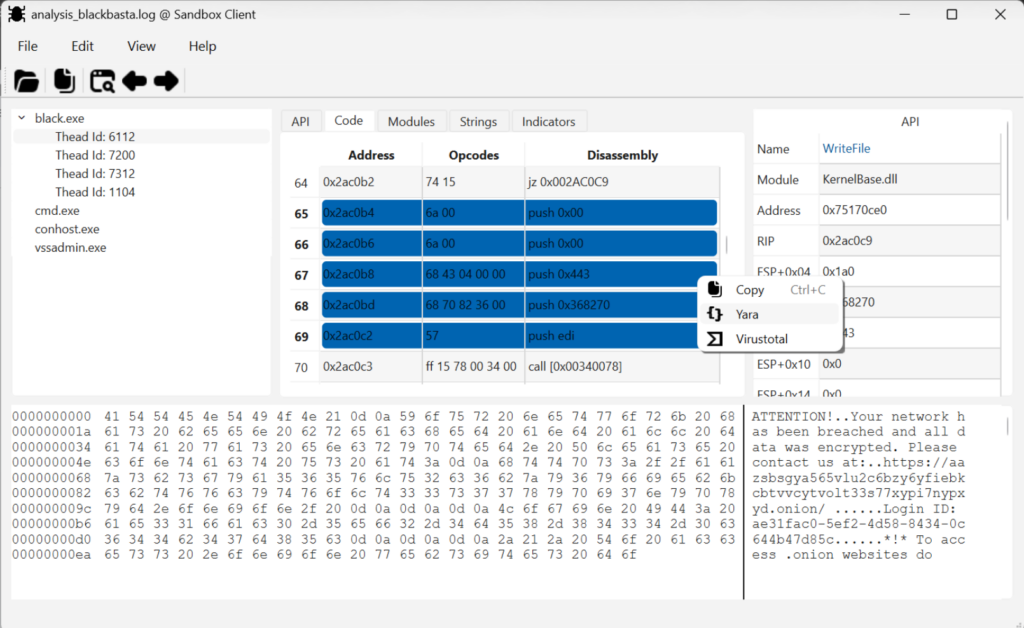
rule ZynapGeneratedRule
{
meta:
author="Zynap"
description="Generated by Zynap Sandbox"
strings:
$0 = {
6a 00 // 0x2ac0b4 push 0x00
6a 00 // 0x2ac0b6 push 0x00
68 43 04 00 00 // 0x2ac0b8 push 0x443
68 70 82 36 00 // 0x2ac0bd push 0x368270
57 // 0x2ac0c2 push edi
}
condition:
all of them
}
Automatically created Yara rule
Zero Maintenance
The maintenance cost of the solution was one of the problems we mentioned at the beginning of this article: updating hundreds of hooks every time Microsoft releases a new version of Windows.
In the solution we have developed, this problem does not exist. The memory permission control mechanism is agnostic with respect to the libraries and the API: it does not need to know each of the functions, only to monitor the boundary between modules.
If a new version of Windows were to appear, let’s call it Windows 12, that adds a thousand new functions to its libraries, our implementation will capture them all from day one, without having to review, add, modify, or eliminate hundreds and hundreds of hooks.
Conclusion
The Zynap Sandbox does not simply represent an incremental evolution within threat analysis; it constitutes a qualitative leap in the way we understand, observe, and contextualize malicious activity. The combination of deep instrumentation, exhaustive traceability, contextual correlation, and multi-layer visibility allows an unprecedented amount of information to be captured, transforming every execution into an extremely rich and actionable source of intelligence.
Compared to traditional approaches, where much of the malware’s behavior remains hidden or fragmented, the architecture of the Zynap Sandbox manages to reconstruct the complete execution cycle with an exceptional level of detail. This not only increases detection capability, but also greatly raises the analytical value of each sample processed, facilitating the identification of TTPs, persistent artifacts, evasive mechanisms, and relationships between campaigns.
Furthermore, the true differentiator does not lie solely in the amount of data captured, but in the practical usefulness of that information. The ability to turn complex telemetry into operational knowledge makes it possible to accelerate investigations, improve incident response, and feed threat hunting, intelligence, and advanced detection processes much more accurately.
Taken together, all these aspects place the Zynap Sandbox at a level that is hardly comparable within the current ecosystem: a platform designed not only to observe malware, but to understand it in depth, contextualize it, and extract the maximum possible value from it.
Keep Reading
Malware authors know that their creations will be executed within virtual machines to perform dynamic analysis and observe their behavior. Aware of this, they incorporate mechanisms capable of detecting certain artifacts or indicators that reveal the execution is taking place in a virtualized environment.
Malware families that incorporate these detections are able to abort their execution to avoid any malicious activity if they detect that they are being analyzed in a virtual environment, thus concealing their behavior during the analysis.
There are two ways to mitigate this situation:
- Use physical machines equipped with a system for recovering the previous state. This way, the malware will not be able to find artifacts related to virtual environments like VirtualBox or VMware.
- Use a mechanism that hides these artifacts typical of virtual machines. This requires deploying different techniques typically associated with rootkits, in which certain aspects of the system are “modified” to hide certain elements.
This article on Defensive Rootkits, written by our Head of Labs, Alberto Marín, explores this second solution for cases where virtual machines are used.